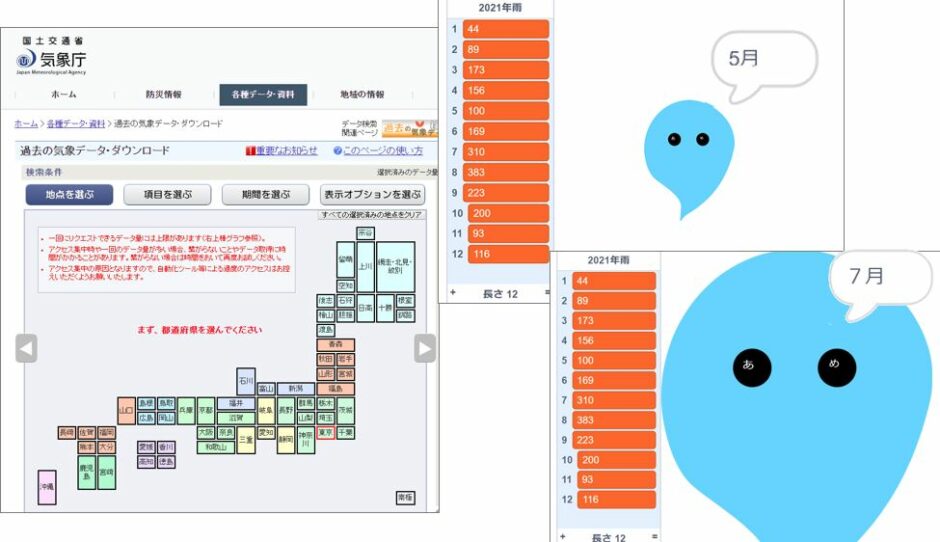
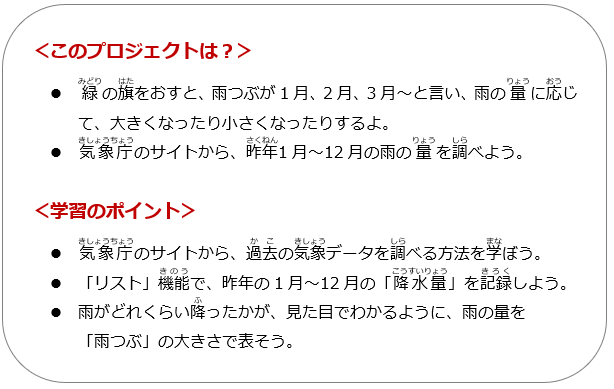
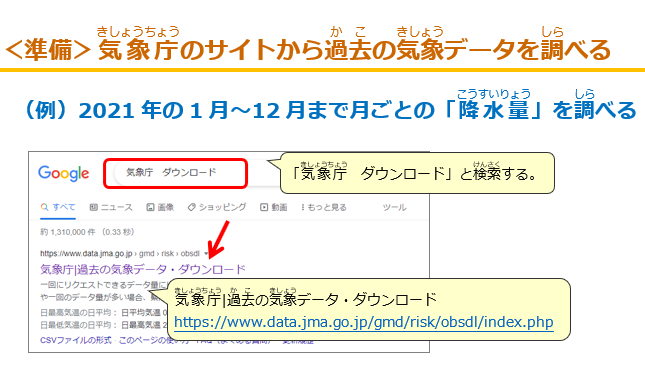
今回は、気象庁のサイトから昨年の降水量のデータを取得して、月ごとの降水量の変化がわかる作品をつくりました。「昨年の梅雨入りはいつだったのかな?」「雨はやっぱり6月が一番多いかな?」という予想を裏切り、昨年(2021年)の東京は、8月が一番雨が多かったです。 エクセルのグラフをつかえば簡単ですが、あえてScrachで楽しい作品になるようにしました。応用編では、取得データをCSV形式にして、Scratchへインポートする方法も学びます。
気象データ① 自分の生まれた日の天気を紹介しよう (ナレッジレッスン)
気象データ② 昨年の雨の量を調べよう(このレッスン)
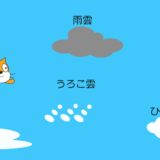
気象データ③ 雲を描いて楽しいゲームをつくろう(ナレッジレッスン)
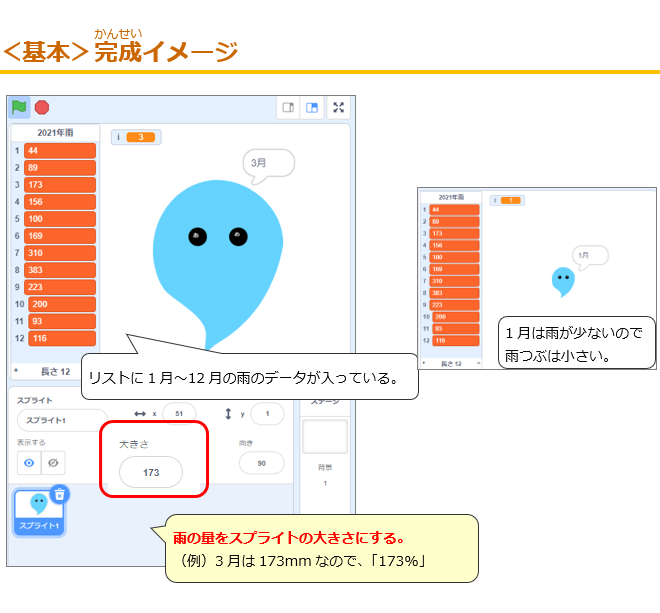
![](https://n-lesson.net/wp-content/uploads/2022/07/1-1.png)
完成作品(基本)
応用の作品→https://scratch.mit.edu/projects/705114155
完成作品(応用)⇒基本と同じだがデータをCSVでインポート
応用の作品→https://scratch.mit.edu/projects/710746201
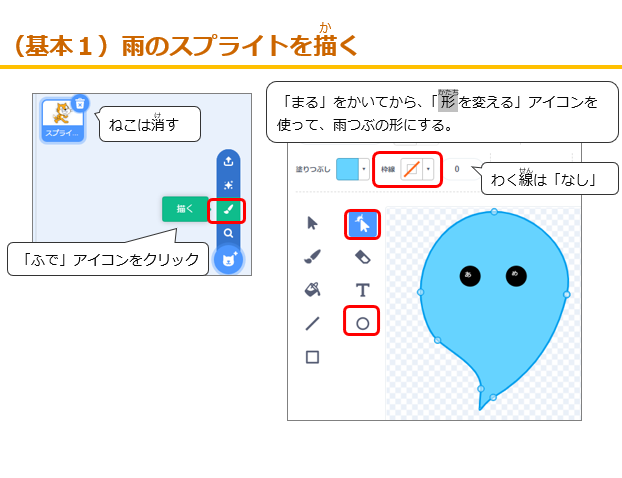
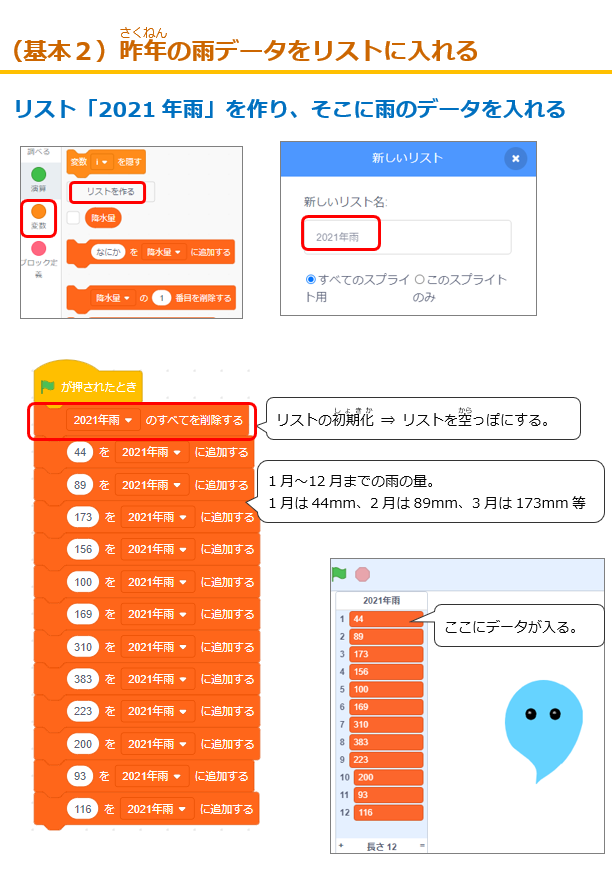
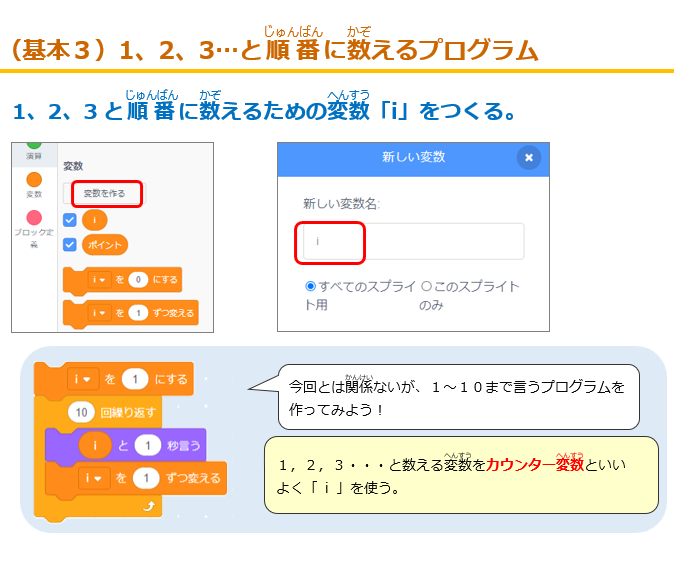
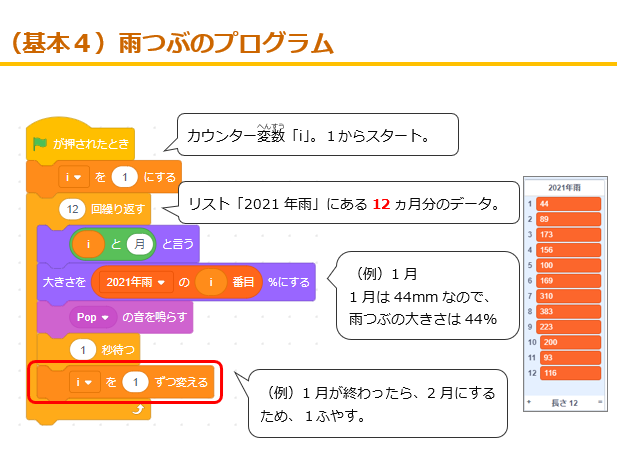
基本の作品をつくろう
![<準備>気象庁のサイトから過去の気象データを調べる](https://n-lesson.net/wp-content/uploads/2022/07/2-1.png)
![地点を選ぶ⇒東京](https://n-lesson.net/wp-content/uploads/2022/07/3-1.png)
![地点を選ぶ⇒東京](https://n-lesson.net/wp-content/uploads/2022/07/4-1.png)
![②項目を選ぶ⇒降水量の月合計](https://n-lesson.net/wp-content/uploads/2022/07/5-1.png)
![③期間を選ぶ⇒2021年1月~12月](https://n-lesson.net/wp-content/uploads/2022/07/6-1.png)
![④画面に表示ボタンをクリック。](https://n-lesson.net/wp-content/uploads/2022/07/7-1.png)
![⑤結果](https://n-lesson.net/wp-content/uploads/2022/07/8-1.png)
![<基本>完成イメージ](https://n-lesson.net/wp-content/uploads/2022/07/9-1.png)
![(基本1)雨のスプライトを描く](https://n-lesson.net/wp-content/uploads/2022/07/10-1.png)
![(基本2)昨年の雨データをリストにいれる](https://n-lesson.net/wp-content/uploads/2022/07/11-1.png)
![(基本3)1,2,3…と順番に数えるプログラム](https://n-lesson.net/wp-content/uploads/2022/07/12-1.png)
![(基本4)雨つぶのプログラム](https://n-lesson.net/wp-content/uploads/2022/07/13-1.png)
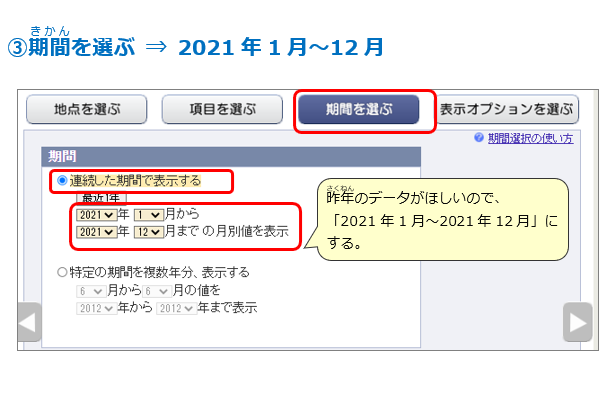
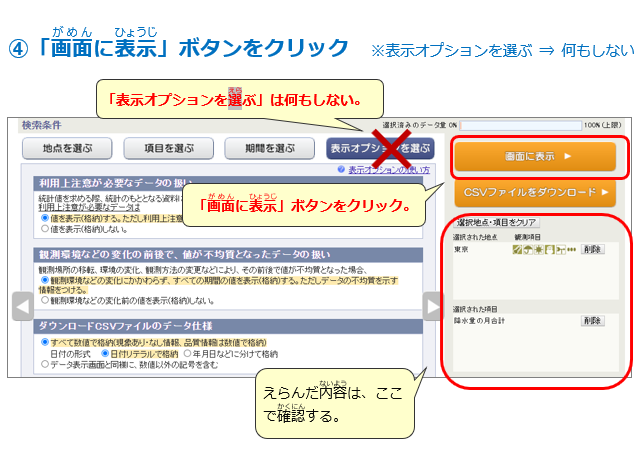
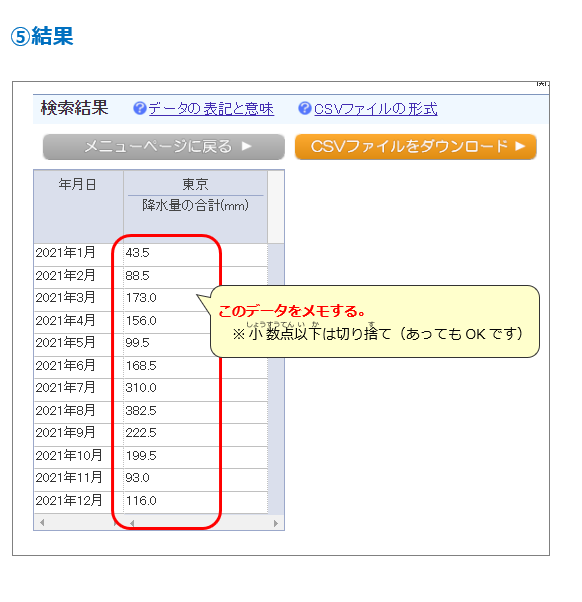
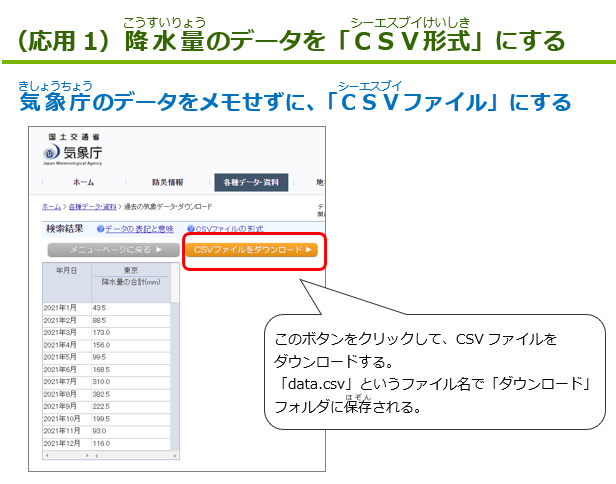
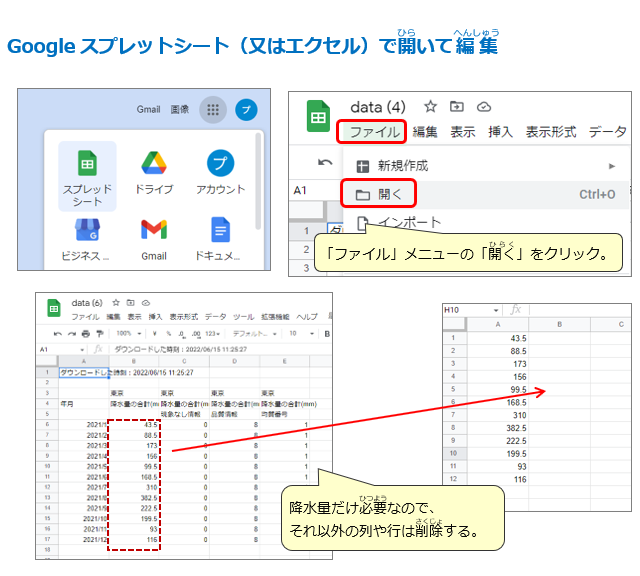
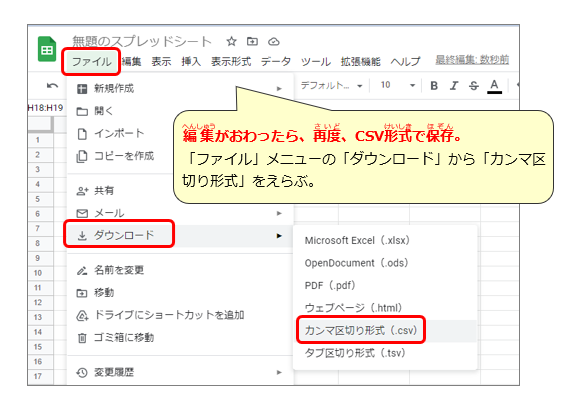
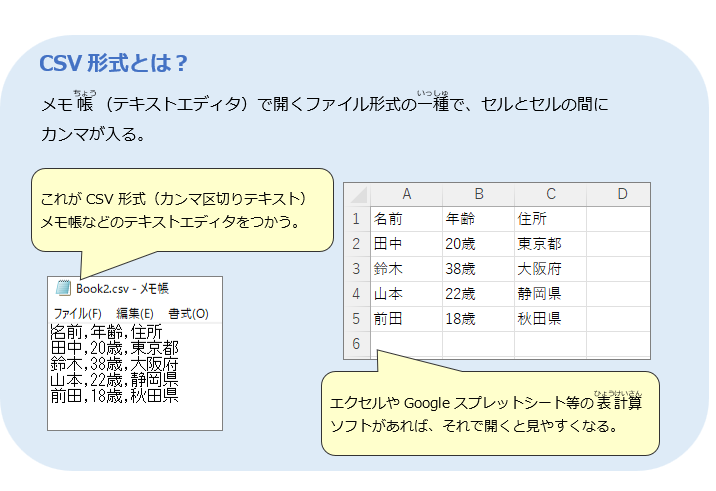
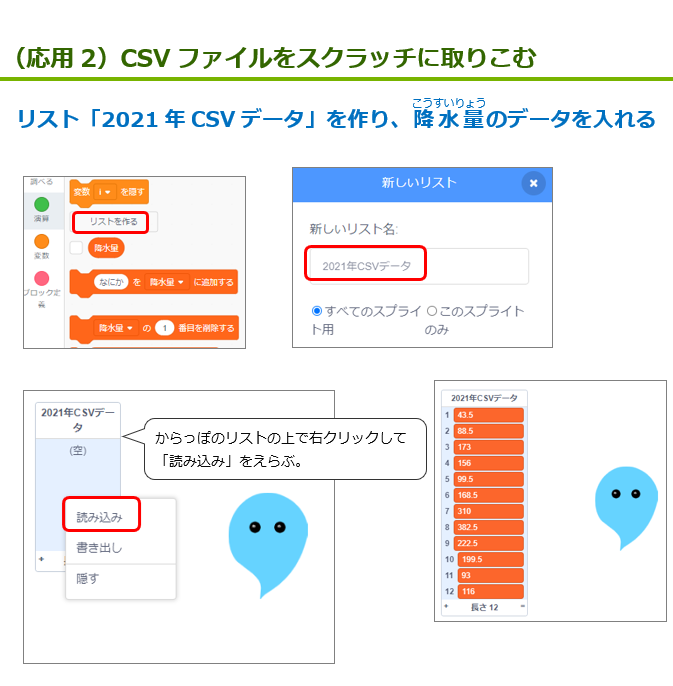
降水量のデータをCSV形式でインポートしよう
![(応用1)降水量のデータをCSV形式にする](https://n-lesson.net/wp-content/uploads/2022/07/14-1.png)
![Google スプレットシート(又はエクセル)で開いて編集](https://n-lesson.net/wp-content/uploads/2022/07/15-1.png)
![Google スプレットシートで編集後、再度SCV形式で保存する。](https://n-lesson.net/wp-content/uploads/2022/07/16.png)
![CSV形式とは?](https://n-lesson.net/wp-content/uploads/2022/07/17.png)
![(応用2)CSVファイルをスクラッチに取り込む](https://n-lesson.net/wp-content/uploads/2022/07/18.png)